
Water is vital to every being. It’s a necessity to survive and function. Almost every necessity humans need daily requires water to either operate or to be produced. So it’s safe to say that water is a part of everything we use, from transportation to eating and everything else.
Most water-consuming activity
You may be surprised, but the answer would be the agricultural industry. This is because a huge portion of the world’s limited water resources goes to agriculture. For example, 2.5% of the earth’s water is fresh, and 70% of all freshwater goes to this industry alone.
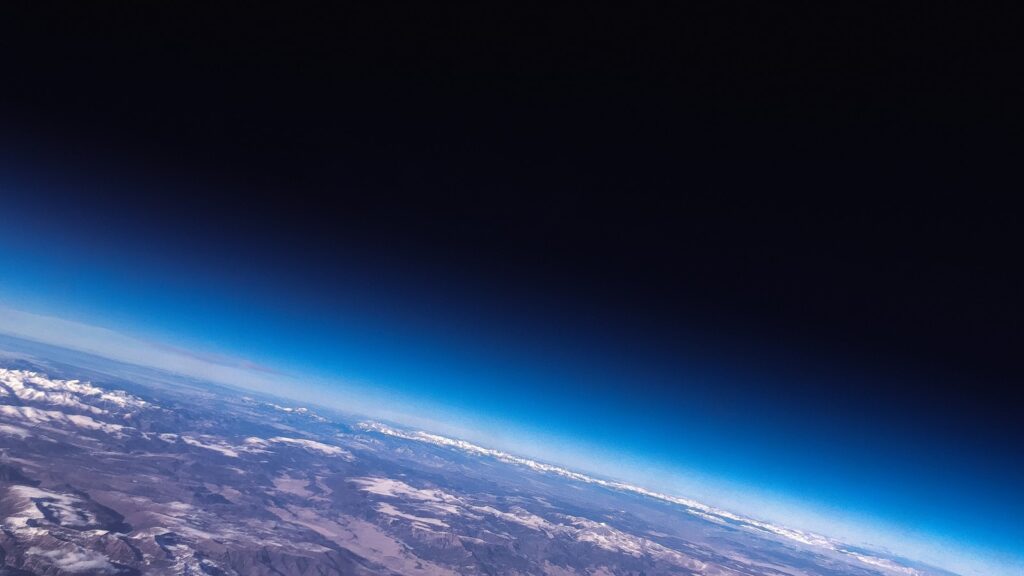
The agriculture industry is aware of its negative impact on the world’s resources. It has then actively tried to limit its water usage through advanced irrigation systems, dry farming, and drought-tolerant crops.
While this is appreciated, these efforts may not be enough, especially with the expected increase in population to almost 10 billion people by 2050.
One means by the farmers is implementing technologies that aim to schedule the watering of crops strategically, specifically when evaporation and water loss are most minimized. Thankfully, these efforts can help save 80% more water than traditional methods.
If you do not know yet, consumptive is what we call any water utilized but not recycled. On the other hand, non-consumptive is any water recycled after use. We are hoping to have more non-consumptive water for sustainability purposes.
Different industries and their water use
Agriculture and consumer goods
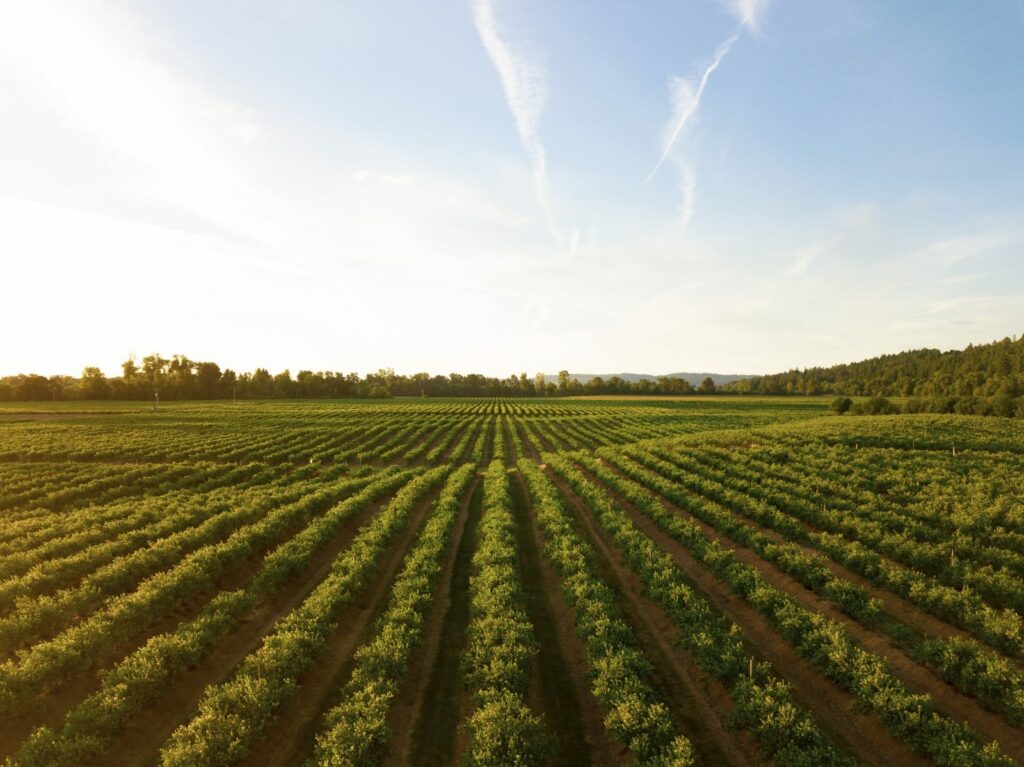
Agriculture accounts for approximately 80 percent of the United States consumptive water use.
It’s easy to think why the agriculture industry consumes so much of the world’s water resources. Just imagine the huge water sprinklers in large fields of crops. The overhead sprinklers need to water than needed because much of the water is lost due to runoff and evaporation.
Overhead sprinklers and trench irrigation are two of the most famous irrigation methods used by farmers. Trench irrigation systems work by having trench canals carry water from a source to the crops and fields. The two methods are commonly utilized due to their relatively lower cost.
Water is used for everything from cooling systems in factories to agricultural production of raw materials. For example, it takes around 1,847 liters of water to produce one kilogram of beef, while only 1500 liters are needed to produce a kilogram of wheat.
This shows that while fruit and vegetable agriculture uses more water than meat production, the industrial meat complex still uses much water. In addition, other goods such as paper, cotton, and aluminum also have a high water footprint due to the processing required to produce them.
Assessing the water footprint (WF) can help understand the consumption of freshwater by specific human activities or production processes of a product. Overall, it is clear that the production of consumer goods is one of the largest consumers of freshwater resources worldwide.
Aquaculture
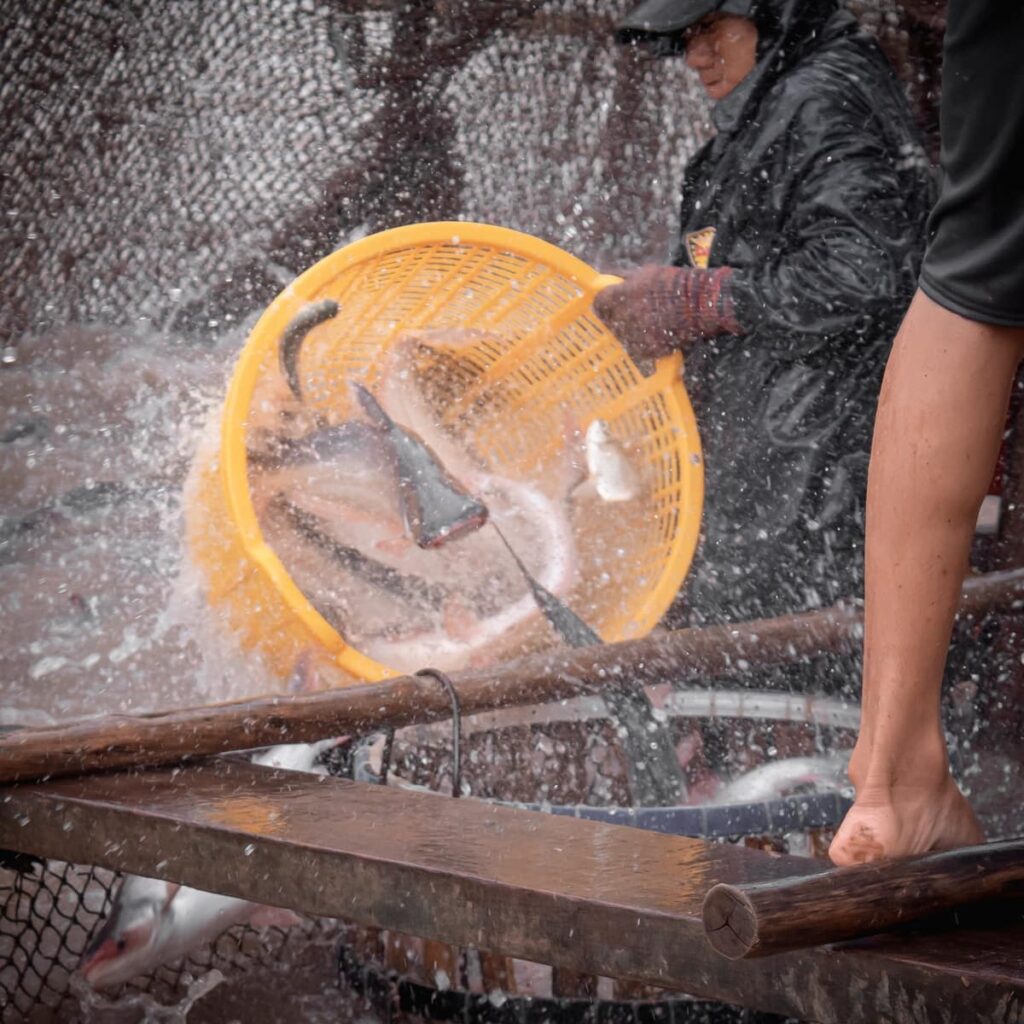
Aquaculture is like agriculture for raising fish, shellfish, algae, or aquatic plants. Since the amount and quality of water from lakes, rivers, and oceans are decreasing, aquaculture is becoming a great source for these water animals.
In other words, aquaculture raises fish instead of hunting for them. So the next time you buy your fish supply in the market, check the label! If it says “farm-raised,” it surely is raised via aquaculture.
Industrial
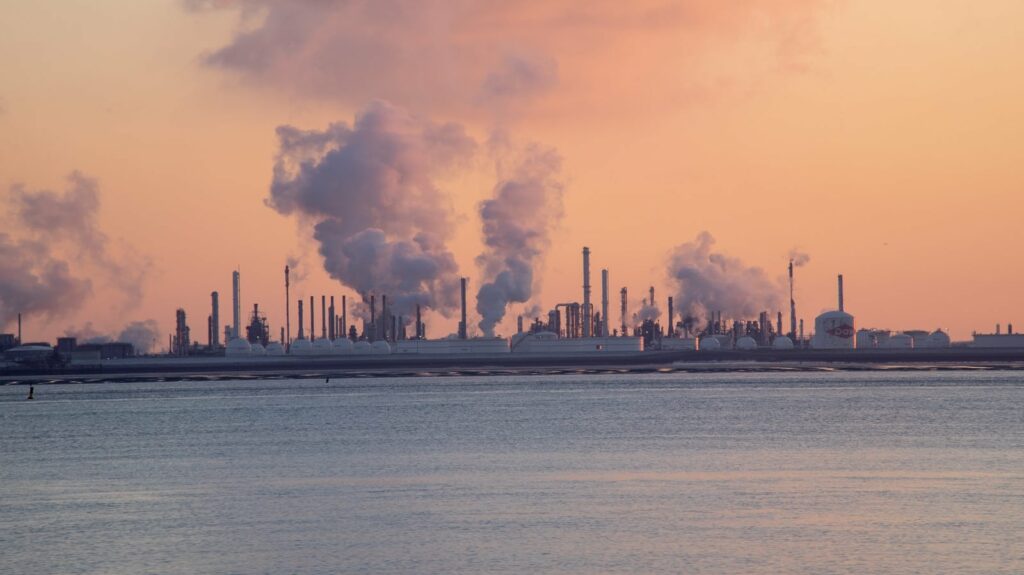
Now this industry accounts for around 15% of water use globally. From power plants to oil refineries, water consumption truly is significant. Additionally, manufacturing plants also use water. On a lighter note, hydroelectric power plants are strategically built around rivers for energy generation, and this is a great example of non-consumptive water!
The most common type of nuclear power plant uses water for cooling in two ways: To convey heat from the reactor core to the steam generator and to dissipate heat from the steam generator to the atmosphere.
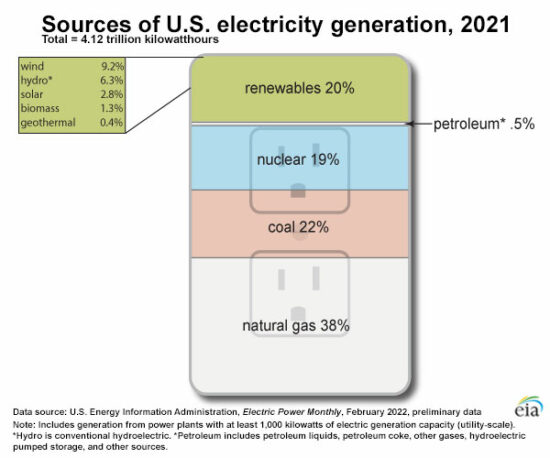
Thermal power plants, which produce around 80% of the electricity in the US, also use water for cooling.
In fact, cooling power plants make up the largest portion of total water use. This is because cooling towers, part of most recirculating systems, require large volumes of water to dissipate heat.
Hydropower and thermoelectric power make up 98 percent of the world’s electricity generation, and these two most common forms of power are also the most water-intensive. The U.S. Environmental Protection Agency has issued reports on reclaimed water and reuse to reduce the water needed for cooling power plants.
Household
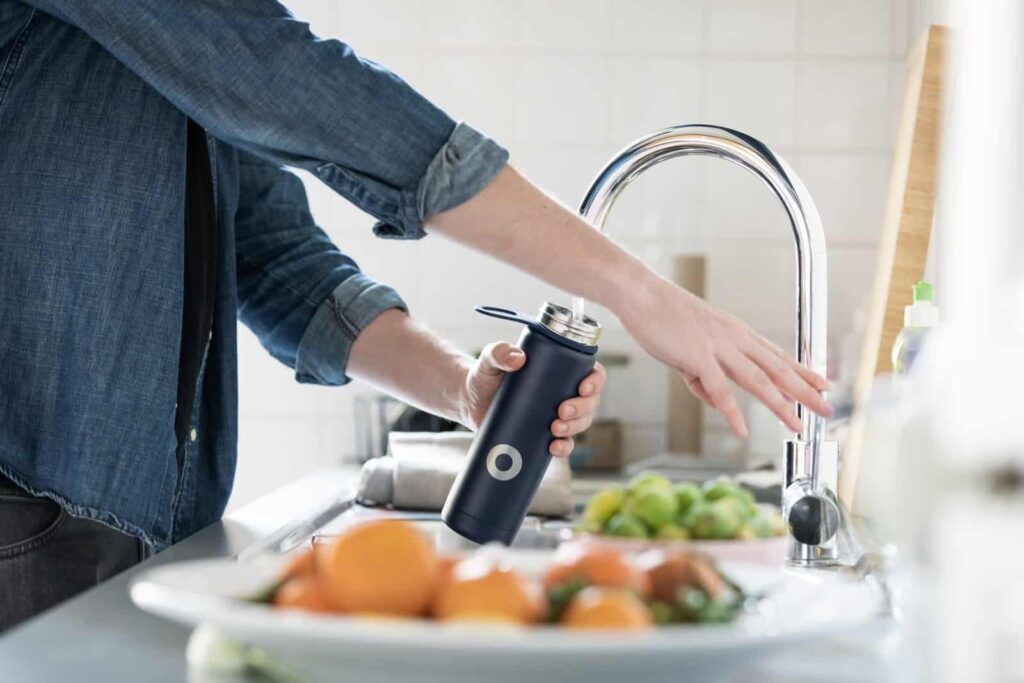
Just count the times you use water in a day: the water you drink, use for cooking, flush toilets, and the list goes on and on. So much of our lives are tied to water usage, especially in developed countries. Personal water use accounts for about 15% of water usage worldwide.
There are numerous ways we can turn our water from consumptive to non-consumptive. The little things we can do can make a difference when added up! Be a responsible consumer!
Recreational

Some recreational activities using water are swimming, boating, and fishing. This may surprise you, but even gold is tied to water usage. How? Because the golf course requires water! However, it’s great to note that recreational activities use relatively low amounts of water: less than 1% of global water usage!
Ski resorts are one of the most visible forms of climate adaptation, as snowmaking is an integral part of the global ski industry. According to Kevin Rein, state engineer, and director of the Colorado Division of Water Resources, an investigation of the majority of Colorado’s ski resorts indicated that snowmaking diverts around 1.5 billion gallons (6.8 billion liters) of water every year in the state. That’s enough to fill roughly 2,200 Olympic-sized swimming pools.
Thredbo, Australia’s first snow resort, uses water for snowmaking, but most of it is recycled and reused. Despite the amount of water used, only 0.05% of the total water is diverted to human uses in the region.
Fortunately, most recreational activities have water utilizations that are non-consumptive. This means we can boat, fish, and swim without depleting the water supply.
Environmental
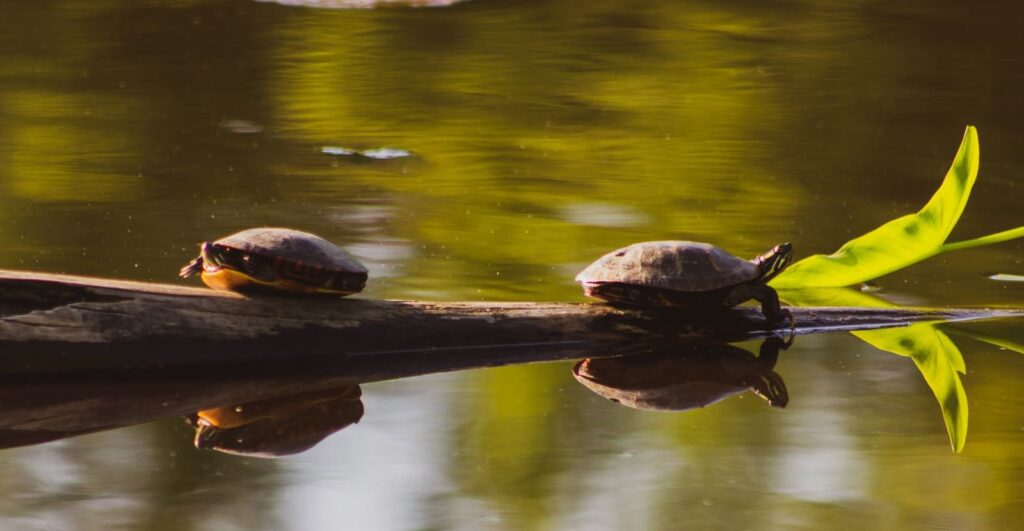
For environmental purposes, water is used to create a habitat for wildlife. Specifically for building artificial lakes and fish ladders to help fish spawn. Thankfully, this industry’s use of water is mostly non-consumptive as well!
Conclusion
Water is a crucial resource for all of us, and its careful management is essential to ensure that it continues to be available for future generations. Agriculture is the largest consumer of water used by humans worldwide, accounting for almost 80% of total human water consumption. This places a large strain on the available water resources, and it is important to be aware of this to ensure that these resources are not over-utilized.
Additionally, water is necessary for many other human activities, such as cooling power plants, recreational activities, snowmaking, and consumer goods. By being mindful of our water consumption and taking steps to conserve and reuse it, we can ensure that this precious resource will continue to be available for generations.
Save water!
While you may think the depleting water supply does not affect you, think again! Your actions today may impact the world the next generation will live in, including your children and grandchildren.
We cannot just rely on huge companies to put in effort when we can make it a habit to save water ourselves. A great place to start is by changing your dishwashing and showering habits. Best of luck!

Jay
Jay is a health and wellness enthusiast with expertise in water quality and nutrition. As a knowledgeable advocate for holistic well-being, Jay successfully manages Type 2 Diabetes through informed lifestyle choices. Committed to sharing reliable and authoritative insights, Jay combines firsthand experience with a passion for enhancing health."
